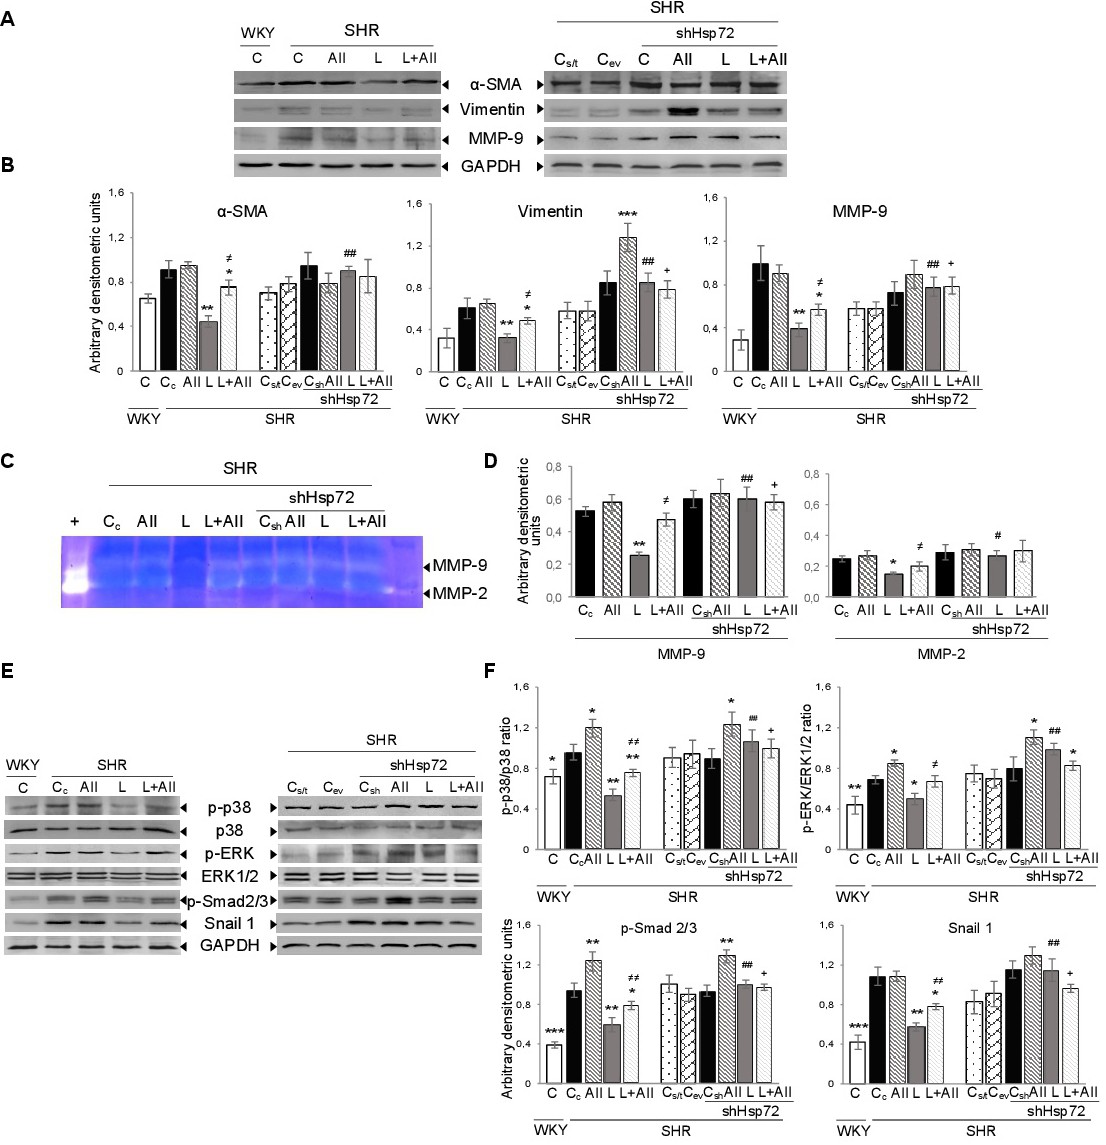
Fig. 3. Hsp70 under the Losartan effect in the expression of mesenchymal markers. Immunoblot analysis of A) α-SMA, vimentin and MMP-9 in total fractions from SHR PTCs and shHsp72 Knockdown SHR PTCs. Cells were subjected to different treatments: Control (Cc or Csh), Angiotensin II (AII), Losartan (L) or Losartan plus Angiotensin II (L+AII) and SHR PTCs empty vector transfected (Cev) or non-transfected (Cs/t). GAPDH was used as loading control. Representative images of 3 independent experiments are shown. B) Band intensities were quantified by densitometric analysis. C) Zymographic analysis of the conditioned media derived from SHR PTCs and shHsp72 Knockdown SHR PTCs subjected to different treatments is shown. Samples equalized for protein content were separated on a 10% SDS-polyacrylamide gel containing 0.1% gelatin. Proteolytic activity was demonstrated by digestion of gelatin, resulting in the bands of clearing. The locations of bands corresponding to MMP-2 and MMP-9 are indicated. D) Band intensities were quantified by densitometric analysis. Immunoblot analysis of E) p-p38, p38, p-ERK, ERK 1/2 p-Smad 2/3 from SHR PTCs and shHsp72 Knockdown SHR PTCs total fractions. Cells were subjected to different treatments. GAPDH was employed as loading control. Representative images of 3 independent experiments are shown. B) Band intensities were quantified by densitometric analysis. Bars means ± SEM, n=3. *p≤0.05; **p≤0.01; ***p≤0.001 vs SHR PTCs control group (Cc). #p≤0.05, ##p≤0.01 vs SHR PTCs (L). ≠ p≤0.05, ≠≠ p≤0.01 vs SHR PTCs (AII). + p≤0.05; ++p≤0.01 vs SHR PTCs (L+AII).